
 Equipment photo↗
EQUIPMENT SERIES
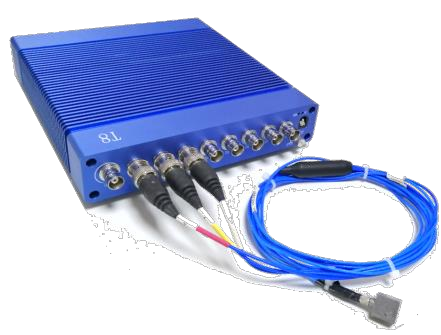
T8-2X Shock and Drop Measurement System
Capture transient acceleration during drop, shock, bump, inclined-impact or pendulum tests and analyze the recorded event.
T8-2X
APPLICATION NOTE · T8-DSA-202
Shock tolerance band analysis builds the “nominal pulse plus tolerance band” requirement of shock test standards into the measurement software. The reference pulse, the upper and lower tolerance limits and the measured waveform are overlaid on one time axis, so it is immediately clear whether a pulse falls inside the permitted envelope. Automatic alignment and point-by-point exceedance statistics turn a visual judgment into a quantified, recordable result for test validation and quality screening.
The function is organized around three overlaid traces: reference pulse, tolerance band and measured pulse. It consists of a standard pulse library, tolerance settings, the overlay display, automatic alignment, exceedance statistics and multi-channel continuous recording.
Five nominal shock pulses are built in. They correspond to the pulses defined in widely used shock test standards.
| Pulse shape | Characteristic | Typical use |
|---|---|---|
| Half-sine | Smooth half-period sine arch | General environmental shock; package and transport tests |
| Terminal-peak sawtooth | Linear rise to the peak, then a steep drop | Tests matched to a shock response spectrum |
| Initial-peak sawtooth | Immediate rise to the peak, then a linear decay | Simulating fast impact events |
| Triangle | Symmetric triangle | Training and comparison tests |
| Trapezoid | Flat-top pulse with ramped edges | High-energy shock simulation |
The reference amplitude (peak acceleration in g) and pulse duration (ms) are entered directly. The duration setting covers 0.313 ms to 80 ms, from component-level to packaged-product tests. The corresponding velocity change is displayed as soon as the values are entered, for comparison with the standard.
Tolerance requirements from common shock standards are available as templates.
| Tolerance template | Standard scope |
|---|---|
| GJB 150.18A / MIL-STD-810 | Laboratory environmental test methods for military equipment (shock) |
| IEC 60068-2-27 / GB/T 2423.5 | Environmental testing of electrical and electronic products: shock |
| RTCA DO-160G | Environmental conditions and test procedures for airborne equipment |
| MIL-STD-883 / GJB 548 | Test methods and procedures for microelectronic devices |
| IEC 61373 | Railway rolling stock equipment: shock and vibration tests |
| Custom | Defined from a product specification or customer agreement |
A custom band is divided into a pulse region and left and right edge regions, each with its own upper and lower percentage (for example 15 % in the center and 20 % on the edges). The software generates the upper and lower limit lines from these values. Each parameter set can be saved as the default.
An indicator shows “over upper limit” or “below lower limit” as soon as the measured pulse leaves the band.
The position of a shock in the time window shifts with early or late triggering. A fixed reference would then report false exceedances. Automatic alignment shifts the reference and band along the time axis to the position with the fewest exceedances and the best waveform match, so no manual positioning is needed.
When enabled, the measured waveform is compared with the limits point by point across the sample window. The software counts out-of-band points, reports the exceedance ratio and reports how closely the matched channel follows the reference. The result can be used as a quantified record of pulse quality.
| Application | What the analysis provides |
|---|---|
| Shock machine waveform verification | Compare the measured table pulse with the standard pulse after the specimen is mounted, and verify the machine output against the test specification. |
| Drop and package transport tests | Check whether the pulse experienced by a dropped package is within tolerance and evaluate package protection. |
| Electronic component screening and qualification | Mechanical shock screening of semiconductors and connectors to MIL-STD-883 / GJB 548, where pulse conformity is a precondition for a valid test. |
| Vehicle and railway electronics | Environmental shock verification to standards such as IEC 61373, with conformity data. |
| Airborne equipment testing | Shock items to RTCA DO-160G or MIL-STD-810 as evidence for qualification. |
| Production sampling | Batch shock sampling, with exceedance statistics to quantify batch consistency. |
A shock machine never reproduces the ideal pulse exactly. Pendulum, drop and pneumatic shock machines are affected by structural elasticity, programmer materials and specimen mounting, so the output always varies around the nominal pulse. Test standards therefore specify a nominal pulse with a tolerance band: the measured pulse must stay inside the band, and integral quantities such as velocity change must stay within their tolerances, for the test to be valid.
The analysis chain has four automatic steps: reference generation, segmented band construction, automatic alignment, and exceedance and velocity-change evaluation.
From the selected pulse type, amplitude A and duration D, the software generates the nominal pulse defined by the standard: half a sine period for a half-sine; a linear ramp with a steep edge for the sawtooth pulses; a symmetric triangle; or a flat-top pulse with ramped edges for a trapezoid.
The reference and band are shifted along the time axis. For each position the software counts out-of-band points. The position with the fewest exceedances is selected first, and the highest normalized correlation second. This removes the effect of random trigger position and evaluates only the pulse itself.
At the selected position, each measured point is compared with the limits and the out-of-band points are converted to an exceedance ratio. The measured pulse is also integrated over the specified interval to obtain the actual velocity change, which is compared with the nominal value (for example ±15 %) as a second conformity criterion.
| Standard | Title | Pulse and tolerance notes |
|---|---|---|
| IEC 60068-2-27 / GB/T 2423.5 | Environmental testing, Part 2: Tests — Test Ea and guidance: Shock | Half-sine, terminal-peak sawtooth and trapezoid; peak ±15 %; velocity change ±15 % |
| GJB 150.18A / MIL-STD-810 | Laboratory environmental test methods for military equipment: shock | Functional shock, crash hazard and other procedures; envelope evaluation |
| RTCA DO-160G | Environmental conditions and test procedures for airborne equipment, Section 7: shock | Standard pulse envelope and duration tolerances |
| MIL-STD-883 / GJB 548 | Test methods and procedures for microelectronics (mechanical shock) | Severity levels such as half-sine 1500 g / 0.5 ms; ±15 % tolerance |
| IEC 61373 | Railway applications: rolling stock equipment shock and vibration tests | Uses the IEC 60068-2-27 pulses and tolerances; velocity change ±15 % |
| GJB 151A / MIL-STD-461 | Electromagnetic compatibility requirements for military electronic equipment (CS116 damped sinusoidal transients) | Parameterized evaluation of peak current limit, frequency and damping factor |
A control module is verified with a half-sine shock to IEC 60068-2-27 (15 g / 11 ms). The values below are example data.
YOUR NEXT STEP
Choose a family or describe your application. Prepare one inquiry with the details that matter.
Prepare your inquiry