DROP · SHOCK · VIBRATION / EQUIPMENT & INSTRUMENTATION

EQUIPMENT SERIES

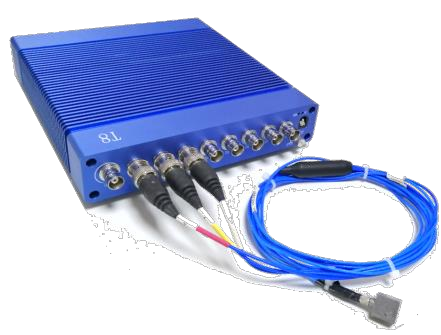
T8-3X Dynamic Signal Analyzer

Acquire and analyze vibration, shock, sound pressure, dynamic force, pressure and voltage signals for measurement, structural response and modal-test workflows.

T8-3X

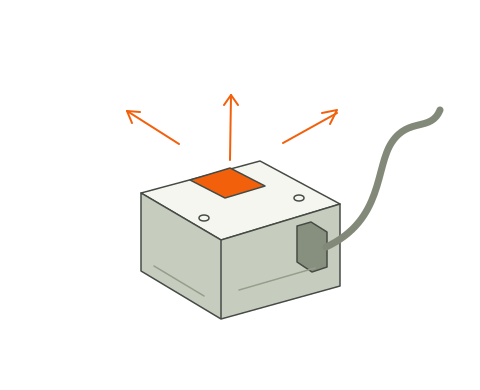
T8-3X Dynamic Signal Analyzer — concept illustration
Concept illustration — not a specific product configuration.

APPLICATIONS

Where it fits

  • Acquire and analyze vibration, shock, sound pressure, dynamic force, pressure and voltage signals for measurement, structural response and modal-test workflows.

SYSTEM DETAILS

Equipment and functions

  • Time and frequency-domain analysis.
  • Triggering, filtering, averaging and windowing.
  • Recorded-data replay and report generation.
  • A signal-source output supports compatible excitation setups.
  • Sensor selection and conditioning depend on the measured quantity.

SELECT A MODEL

Specifications & configurations

Compare models side by side. On smaller screens, swipe within the table; the parameter column stays in place.

Catalog specifications are shown for model selection. Confirm the configuration, units and test conditions in your quotation. Fields marked “Confirmation required” need an agreed specification before ordering.

T8-3X hardware
ParameterT8-3X
Input channelsConfirmation required
Sensor inputsDirect charge (PC) and voltage (IEPE/ICP)
Signal-source outputs1
Sampling rate102.4 kHz; 1 MHz optional
A/D resolution (bit)24
Dynamic range (dB)≥110
Amplitude accuracy0.02 dB at 1000 Hz
Frequency accuracy25 ppm at 1000 Hz
Harmonic distortion−100 dB at 1000 Hz
Analysis frequency range (Hz)DC–40000
Spectral lines100–25600
Computer interfaceUSB 3.0
Power adapter110–240 VAC, 50–60 Hz
Portable enclosure (L × W × H)19 × 17 × 3.3 cm (7.5 × 6.7 × 1.3 in)

SYSTEM DETAILS

Software & control functions

Select the required functions with the hardware configuration. Extended and optional modules are not assumed to be included.

Base analysis

Time waveform (TIME)
View sampled signals in the time domain.
Linear frequency spectrum (LFS)
FFT line spectrum.
Auto power spectrum (APS)
Auto-power spectral analysis.
Power spectral density (PSD)
PSD analysis.
Historical statistical line (HSL)
Track historical statistics.
Integral evaluation
Integrate acceleration waveforms.
Statistics and data processing
Amplitude statistics, RMS, harmonic distortion, trigger modes, filter design, averaging and windowing.
Reports
Save and replay data; Word, Excel, PDF, Text and BMP output.
Extended analysis — confirm selected options

Correlation (ACO / CCO)
Autocorrelation and cross-correlation.
Coherence (COH)
Coherence function.
Frequency response (FRF)
Transfer-function analysis.
Impulse response (IRF)
Impulse-response function.
Histograms (PDF / CDF)
Probability density and cumulative distribution.
Signal source
Fixed/swept sine, triangle, white noise, broadband/burst/pseudo-random, compensated shock, pulse and user-defined waveforms are listed in the catalog overview.

Additional options listed in the overview — confirm package

Cross power spectrum (CPS)
Listed as an additional function; confirm the software package.
Real-time octave (OCT)
Listed as an additional function; confirm the software package.

BEFORE ORDERING

Configuration & confirmation notes

  • Confirm the input-channel count for the ordered hardware configuration.
  • Analysis functions and hardware options must be agreed for the required sensors and measurements. Confirm the software edition and current operating-system support.

Related equipment